Try Power Bi & put your organisation’s finances at your fingertips. Access real time financial data & bespoke reports in a clear, visual format.
What is Power Bi?
Microsoft Power Bi is a data visualization analytics tool that consolidates information from multiple sources into a streamlined, easy-to-read dashboard. It empowers organisations to monitor every aspect of their finances in real-time, enabling precise reporting and data-driven decision-making with live insights.

Power Bi will save you time and money (and help you make better financial decisions)
A word from one of our satisfied customers…

“Our finance worker loves the templates as she can see the whole business and correct any errors efficiently. We no longer need to prepare our management accounts as they are always there for us. We can also fully trust the output which has helped us hugely with forecasting in difficult times. The visual representation gives an overview of every aspect of our financial position in a stunning format we couldn’t have previously imagined.”
Simon Allen, CEO, Age UK Bath & NE Somerset
Power Bi in action
On average we use ten templates during the month to review the organisation for all our analysis & reporting requirements. The information is live and will feed directly from your finance system, using a secure backend server link.
This is a board
summary report
showing the main
contributors of
the organisation.
Additional
contributors can
be easily selected,
making it fully
customisable.
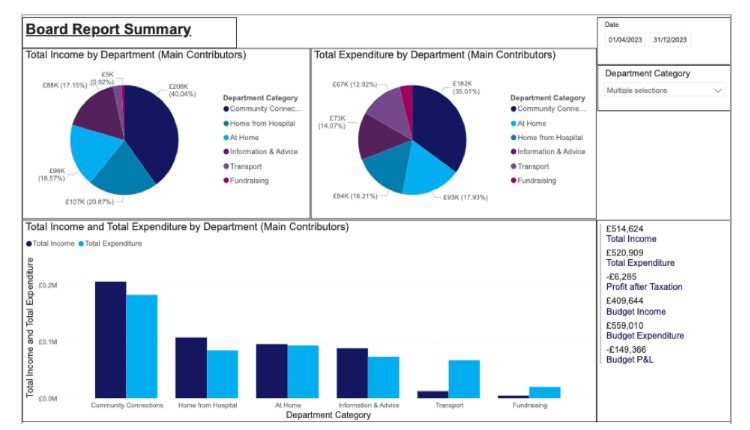
Using this board report summary enables the user to view the income and expenditure of the main contributors of the organisation. You can drill down into any aspect of the organisation by selecting any part of the visuals. This allows you to quickly review the detail behind the numbers, by displaying the invoices, journals and bills which are creating the charts.
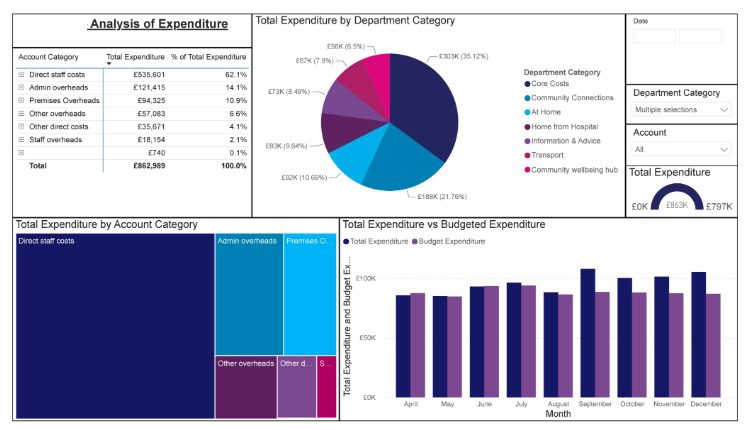
This screenshot is a snapshot from one of our clients’ dashboards, showing a breakdown of expenditure over three quarters.
This real-time dashboard can be used in several ways:
A cost effective, bespoke package just for you!
We will work with you over a one-month period to create a set of templates bespoke to you.
This process involves the following tasks:

Bespoke mapping
Ensure data sources are
accurately linked.

Data clean up
Prepare your data for use

Backend setup
Link Power BI to your
finance system.

Cloud server set up
Access your data from
anywhere.

Template build
Personalised templates built
with your input.

Training
Learn how best to utilise the
templates for daily use.
Costs
We can setup and manage Power Bi as part of a monthly financial outsourcing package or as a standalone project.
Setup fee
Price on application
The setup cost will depend on the health of your existing finance system
Monthly fee
£99
Includes a direct link to your bespoke dashboards and support from our dedicated team.